
 MUO
MUO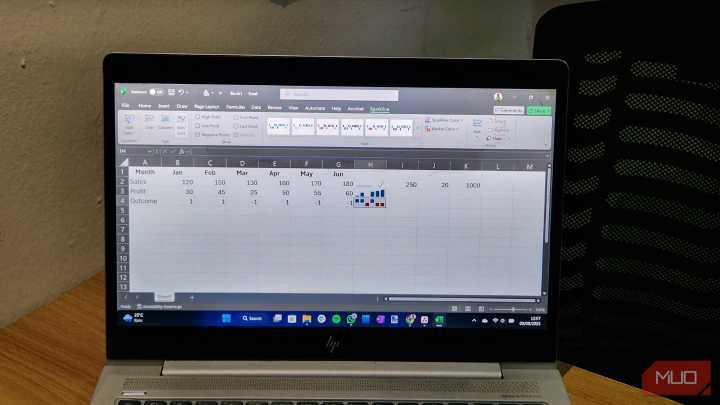
Let’s say you're scrolling through rows of quarterly sales data, trying to figure out which regions are trending up or crashing down. Instead of squinting at numbers or plotting a separate chart, Excel has a built-in feature that shows the trend right inside a cell.
Spot Patterns Instantly with In-Cell Sparklines
Excel Sparklines are mini charts that live in a single cell, giving you a quick visual of your data. With just a glance, you can answer questions like " is this product selling better over time? " or " did performance drop last quarter? "
You can choose from three types of Sparklines: Line , Column , or Win/Loss . Each works best for different things:
Chart Type
Description
Line Sparklines
For showing trends over time, like tracking sales across months.
Column Sparklines

 America News
 The Motley Fool
 Rolling Stone
 The Daily Beast
 Idaho Statesman Entertainment
 IMDb Movies
 Newsweek Top